

Updates for lifetime, unlimited sites, unlimited downloads, and regular updates.
$3.99
 BookmarkBookmarked
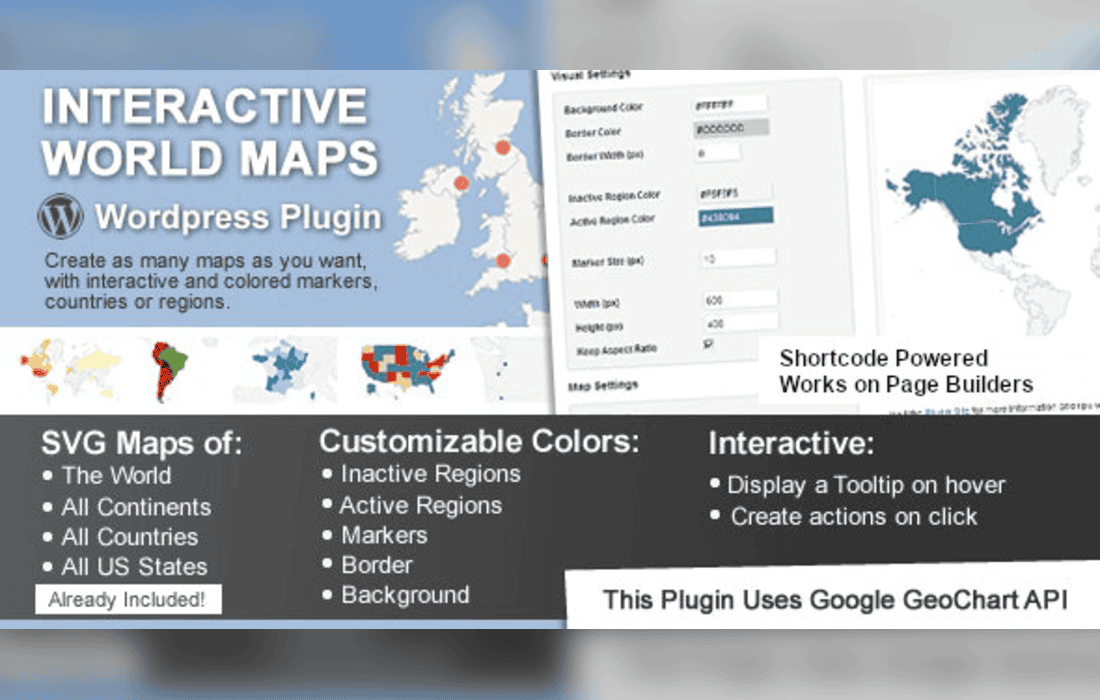
Interactive World Maps is a powerful WordPress plugin designed to help website owners create highly customizable, responsive, and interactive map visualizations without requiring advanced programming skills. By leveraging the power of JavaScript and SVG technology, this tool allows users to display geographical data, highlight specific regions, and provide an engaging user experience that encourages visitors to explore global or local information directly on a webpage.
At its heart, Interactive World Maps utilizes SVG (Scalable Vector Graphics) to render maps. This choice of technology ensures that the maps remain crisp and clear regardless of the screen size or resolution, making them inherently responsive for mobile devices, tablets, and desktop computers. Unlike raster-based images, these SVG maps are lightweight, ensuring that they do not significantly impact page load times, which is a critical factor for both user experience and search engine optimization.
The plugin provides a user-friendly interface within the WordPress dashboard, allowing administrators to generate shortcodes that can be placed anywhere on a site. Whether you are looking to showcase store locations, travel destinations, or statistical data across different countries and states, the plugin acts as a bridge between raw data and a visual, interactive interface.
The plugin is built with flexibility in mind, offering a wide array of settings to ensure the maps align with the branding and aesthetic requirements of any website. Users can modify colors, borders, and hover effects to create a cohesive look. The ability to customize the appearance of individual regions allows for data-driven storytelling, where specific colors can represent different categories, values, or statuses.
One of the standout features is the interactive nature of the maps. When a user hovers over a specific country, state, or province, the plugin can trigger tooltips that display custom information. These tooltips can be configured to show text, links, or even images, providing a secondary layer of information that keeps the interface clean while offering depth for interested users.
Furthermore, the plugin supports various map projections and types. Beyond the standard world map, users can access maps of specific continents, individual countries, and even sub-national regions like states or provinces. This granularity makes the plugin suitable for both global enterprises and local businesses looking to highlight their service areas.
The versatility of Interactive World Maps makes it a valuable asset across numerous industries. Below are several common scenarios where the plugin excels:
For users who require more than just a static display, the plugin offers integration capabilities that allow for dynamic interaction. The ability to link regions to specific URLs means that the map can function as a navigation menu. When a user clicks on a country, they are redirected to a relevant page, which is an excellent way to handle multi-regional websites or localized content hubs.
The plugin also handles the complexity of map markers. Users can place pins or markers on the map to denote specific cities or points of interest. These markers can be customized with different icons and can also trigger tooltips or actions, allowing for a hybrid approach where both regional data and specific point-based data are displayed simultaneously.
In the modern web landscape, responsiveness is not optional. Interactive World Maps is engineered to handle various screen orientations and sizes gracefully. The maps automatically scale to fit their container, ensuring that the user experience remains consistent whether the visitor is on a smartphone or a wide-screen monitor. This responsiveness is handled through the underlying SVG structure, which avoids the common pitfalls of pixelated images or broken layouts.
Additionally, the plugin is designed to be lightweight. By avoiding heavy external dependencies where possible, it maintains a small footprint. This is essential for maintaining high performance scores in tools like Google PageSpeed Insights, which is vital for maintaining high search engine rankings.
The administrative interface is designed to be intuitive. Users do not need to edit code to create a map. Instead, they select the map type, choose the regions they wish to highlight, assign colors, and input the desired tooltip content through a series of forms and dropdown menus. Once the configuration is saved, the plugin generates a unique shortcode. This shortcode can be pasted into any post, page, or widget area, making the implementation process seamless for both beginners and experienced developers.
The plugin also supports the import and export of map configurations. This is particularly useful for developers who manage multiple sites or who wish to create a backup of their map settings before making significant changes. It allows for a streamlined workflow where a map design can be perfected on a staging site and then easily migrated to a live production environment.
If you are exploring options for map-based visualizations on WordPress, there are several other established solutions available. These alternatives offer varying degrees of complexity and focus, ranging from simple marker-based maps to complex data-driven visualizations:
Choosing between these options depends largely on whether your primary goal is to display geographical data through vector-based regional maps (like Interactive World Maps) or to provide street-level navigation and location finding (like Google Maps-based solutions). Interactive World Maps remains the preferred choice for users who prioritize clean, vector-based regional visualization over satellite-based street mapping.


